Quality of Government matters more than size of government for human development, education and life expectancy

“...It’s not the size of the wave but the motion of the ocean…”

  • Quality of government (QGOV) seems more important than size of government (SGOV) for a variety of domains

  • QGOV is more important for peace, for human development, for health and for education 

  • This exploratory work extends the work of Ed Dolan (Niskanen Centre) and comes with many caveats due to interactions.

  • Outliers such as Singapore and Ireland may be worth closer examination for what is working well in smaller governments 

  • QGOV may have increasing importance at higher levels of development 

  • This may provide exploratory evidence that “state capacity” in certain domains eg innovation, health and education - might be important. This adds to the debate on “state capacity libertarianism” and in terms of current UK policy may inform on whether investing in an “ARPA organisation” or other areas of state capacity is a positive return on investment.

Background 

Economist Tyler Cowen posited a notion of State Capacity Libertarianism. Cowen subsequently linked to a blog referencing the work of Ed Dolan.

The work (2017) developed two scores - QGOV for quality of government and SGOV for size of government.  Dolan analysed two measures of freedom and prosperity the Legatum Prosperity Index and the Cato Human Freedom Index and concluded - with several caveats due to interactions and unknown causality- that QGOV was more important than SGOV. See his work for definitions of SGOV and QGOV.

Idea 

I was intrigued if this work extended to other areas that I am interested in both personally and professionally. (I help allocate $13bn in pension fund and other investments in global equities with an interest in healthcare). 

I chose to look at: 

  • -Peace

  • -Human Development 

  • -Life Expectancy (as broad measure for health)

  • -Education 

As measured by other organisations.

Methods 

I hand inputted data on:

  • SGOV, QGOV, 

  • Human Development Index (UN HDI)

  • Education Index (EDI, as component of HDI)

  • Life expectancy Index (as component of HDI)

  • Peace index (as calculated by non-profit Vision of Humanity)

(Sources at end, errors possible)

I ran scatter plots and Pearson correlations. I tagged for World Bank classifications of income, and by geographic region.

Results 

QGOV vs Peace

QGOV vs Peace.png

Correlation = (-) 0.71 | R2 = 0.5

Higher quality of government had a 0.7 correlation with the Peace Index (where lower score = more peace)

An interactive version of this data, where you can also view by income level (use drop down box) and geography (click circle legend labels) is below. The trend holds for all levels of income.

SGOV vs Peace

Correlation =  0.32 | R2 = 0.1

Size of government had a weaker 0.3 correlation with the Peace Index (where lower score = more peace)

SGOV vs Peace Index.png

The overall correlation is weaker and also suggestive that large governments correlate slightly with the peace index.

An interactive version of this data, where you can also view by income level (use drop down box) and geography (click circle legend labels) is below. Different income levels change the trend line, upper middle level countries inverting - suggesting smaller govts here are better for peace but only weakly.

Geography also changes the trend, with Latin America countries suggesting smaller very weakly trending. It’s weak enough maybe to be considered almost no trend though.

My overall takeaway is that the trend is weak vs QGOV but it is intriguing that income levels change the pattern as do geography.

Peace comment 

As often there are intersections on what components might go into peace. Experts may disagree as to the validity of this index for peace however the methodology is clear and it has some support. 

I find it interesting as it is another lens to judge human “progress” on and therefore what types of government might best foster progress.

QGOV vs HDI, Human Development Index

Correlation =  0.75 | R2 = 0.57

Quality of government has a 0.75 correlation with the Human Develpment Index where larger HDI = more developed.  

QGOV vs Human Development Index.png

It looks to me that the slope is stronger in more developed nations. Gently sloping until about 0.75 on HDI, and then steeper.

An interactive version of this data, where you can also view by income level (use drop down box) and geography (click circle legend labels) is below. You can observe this as the slope is stronger for the richer nations (and a measure of GNP is included within the HDI) but it is the same direcction for all incomes, slightly weak for middle.

SGOV and HDI

Correlation =  -0.53 | R2 = 0.28

Size of government has a -0.5 correlation with the Human Develpment Index (where larger HDI = more developed) suggesting larger governments are moderately better than small governments with some notable outliers such as Singapore, South Korea and to some extent Ireland, and Switerland.

SGOV vs HDI.png

An interactive version of this data, where you can also view by income level (use drop down box) and geography (click circle legend labels) is below.

The trends are weaker split by income level, with there almost no trend in high income and upper-middle income.

I now present the components for life expectancy and education (that go into the HDI seperately).

QGOV vs EDI

QGOV vs Education Index.png
SGOV vs Education Index.png
QGOV vs. Life exp (1).png
SGOV vs. Life exp.png

Comments on EDI, Life expectancy; observations and arguments for state capacity.

Given the weighting in the HDI that life expectancy has, it is unsurprising that QGOV also correlates better than SGOV for life expectancy. 

While there are social and cultural determinants of health of which government would only be a component, I argue that it is still noteworthy that it is not size but quality of government here that seems to count.

Again given the weighting in the HDI for Education, it is again unsurprising that QGOV correlates better than SGOV.

Of note, Chile and Kazakhstan appear on education and to some extent life expectancy as higher perfomer small government countries to join Singapore and Ireland, Switerland.

I chose to examine education and health because in many countries there is on going debate as to the structure and capacity that governments should play in health and education markets. 

This line of argument would suggest where countries do wish their governments to be involved then quality of that government or perhaps “state capacity” could be an important factor. 

This is noteworthy in the UK where there is wide support for a National Health service across the political divide and also for state funded education providing the majority of the populations education. 

Two other tentative observations. It is worth dwelling on where small governments seem to be doing well. I would note Singapore and South Korea and perhaps to an extent Ireland and Switerland. Those countries would be good examples of small, high quality goverments. 

My own theory here is also the importance of social and cultural determinants of health and education. 

For instance, it is unknown what the compliance rate for medications are in various countries. A higher drug medication compliance of cost effective genetic medications in Singapore (arguable driven by a social factor of listening to your doctor properly?!) or of the positive/negative health outcomes of effective elderly social care across countries are mostly unknown. 

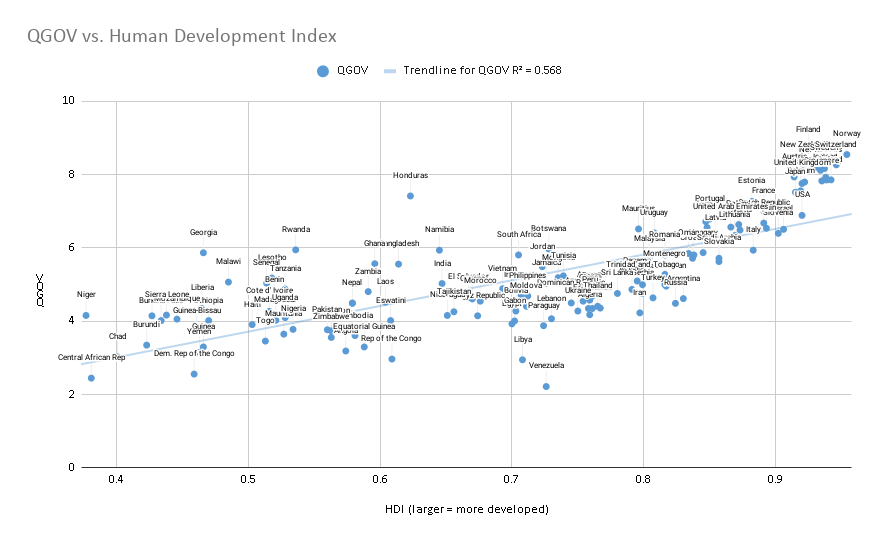
A second observation is the seemingly stronger slope in the high HDI nations. There may be many explanations for this and all the caveats expressed by Dolan also apply but it might be an intriguing provocation that quality of government becomes even more important in extending the progress of already highly developed countries. 

Caveat

As Dolan notes there is considerable interation between SGOV and QGOV as larger governments have a tendency to be of better quality, but Dolan runs multiple regressions here:

“…simple correlations like this need to be interpreted with caution, as there are complex intercorrelations among multiple variables. In this case, we have a correlation of -0.42 between SGOV and QGov, that is, a tendency for larger governments to have a higher index of quality. We also have a correlation of 0.74 between QGOV and the log of GDP per capita (richer countries have higher-quality governments) and -0.48 between SGOV and the log of GDP per capita (richer countries have relatively larger governments).

Dolan can run multiple regressions which I do not have the capcity for, but Dolan concludes:

We can use multiple regression to untangle these interactions, using HFI* as the independent variable and using QGOV, SGOV, and the log of GDP per capita as the dependent variables. When we do so, we get a strongly statistically significant positive coefficient on QGOV and no statistically significant relationship at the 0.01 confidence level for the other two variables. The overall correlation is 0.79, essentially the same as for the two-variable relationship shown in the left-hand scatter plot above…”

I suspect multiple regressions would confirm similar and hope a profesional academic might look into this

Conclusion

I tentatively extend the work of Dolan on the size of government and quality of government to look at four further broad indices of 1) peace, 2)  human development, 3) education and 4) life expectancy. 

In all four cases, quality of government seems to be a more important factor than the size of government. This would be tentative evidence for theories that emphasise the importance of quality - perhaps state capacity - over the size of the state, where societies favour a state role in any given area. 


Notes and Caveats 

Data sheet link available on request. It’s not very tidy but all in good faith. Image below. I may have made errors in the data, as it’s my late night pet -project.

Do read the Ed Dolan Caveats in his blog but repeated here.

“...As in any statistical study, we should be cautious about drawing conclusions about causation. There is nothing in these results to suggest that making a country’s government bigger will automatically make it better. At the same time, it is hard to deny that there is a strong tendency in the cross-country data for larger governments to be better governments, when by “better,” we mean better able to protect property rights, better able to offer impartial civil and criminal justice, and less open to corrupt influences.

Readers are also encouraged to think about the country-by-country data reported in the chart and table above. There is a lot of variety in the world. Too strong a focus either on statistical regularities or on selected outliers can draw us too strongly toward conclusions that, in reality, admit of many exceptions.

For example, the small-government city states of Singapore [is]  rightly admired for [its] prosperity and economic freedoms. However, it gives one pause to note how many small-government countries enjoy neither. Chad, Bangladesh, and the Democratic Republic of Congo  are just the outliers among a whole cluster of countries in that category.

Similarly, a look at individual countries shows that our statistical indicators of “big” and “small,” or of “good” and “bad,” do not always line up with what we mean by these terms in other contexts. For example, many people in the West would readily name Russia and China as countries with governments that are conspicuously both big and bad. Yet, although Russia and China do fall into the southwest quadrant of our chart, they do so only barely. Statistically speaking, neither country is an outlier on either variable…]

Ed Dolan’s two part blog on SGOV and QGOV. 

Peace Index can be found here: http://visionofhumanity.org/indexes/global-peace-index/

Human Development Index and components (both the education and life expectancy - I use 2018 data - ) can be seen here: http://hdr.undp.org/en/data

World Bank Classificatinos are from 2016 (as the 2018 xls wasnt’ working when I compiled the data). The Visuals are H/T Flourish Studios and Google Sheets.

Tyler Cowen on State Capacity Libertarianism 

The Table of data I used is below.

Oil CEOs meet to look at targeting carbon scope 3

Bloomberg reports energy CEOs discuss carbon “scope 3” targets. This could be a pivotal change…

“... Targeting Scope 3 emissions would be a big shift for an industry that produces the bulk of the world’s planet-warming emissions, once that could eventually require them to sell far less oil and gas....”

and

“... The talks between the chief executive officers of companies including Royal Dutch Shell Plc, Chevron Corp., Total SA, Saudi Aramco, Equinor ASA and BP Plc showed general agreement on the need to move toward this broader definition, known as Scope 3, the people said, asking not to be named because the session was closed to the press. The executives didn’t take any final decisions....”

Climate, cognitive strengths of Greta, Bill Gates, Chris Hohn

What do the cognitive strengths of Bill Gates, billionaire hedge fund manager, Chris Hohn and Greta Thunberg have in common? You may know they are all in their various ways committing to climate change solutions - they also bear many of the positive cognitive strengths of the autistic spectrum. Those positives are worth noting in the narrative about what autism can be.

This Bloomberg article looks at the climate activism Hohn’s hedge fund is now engaging in.

Thinking about the framework that intellectual and economist Albert Hirschman suggested

Voice, Exit and Loyalty

And the on-going debates between divestment and engagement (and I do both, but think engagement can be more effective), I am glad all three are using Voice too.


Bloomberg article on Chris Hohn here being a “climate radical” (IMHO, he has been involved here for ages (as you can see through his foundation), although maybe only more recently stepped up stronger actions).

My observations on the Bill documentary, which support views that Bill Gates has autistic thinking strengths.

The wiki on Exit, Voice, Loyalty

Brydon Review into UK Audit

"Language matters." so begins the Sir Donald Brydon Review into UK Audit.

In parts touching on the philosophical, Brydon suggests:

"Audit is not broken but it has lost its way and all the actors in the audit process bear some measure of responsibility."

Recommendations:

• A redefinition of audit and its purpose

• The creation of a corporate auditing profession governed by principles

• The introduction of suspicion into the qualities of auditing

•The extension of the concept of auditing to areas beyond financial statements

• Mechanisms to encourage greater engagement of shareholders with audit and auditors

• A change to the language of the opinion given by auditors

• The introduction of a corporate Audit and Assurance Policy, a Resilience Statement and a Public Interest Statement

• Suggestions to BEIS' work on internal controls and clarity on capital maintenance • Greater clarity around the role of the audit committee;

• A package of measures around fraud detection and prevention • Improved auditor communication and transparency

• Obligations to acknowledge external signals of concern • Extension of audit to new areas including Alternative Performance Measures

• The increased use of technology

Brydon quoting Karthik Ramanna  “I know of no better system than market capitalism to sustain liberty and create prosperity – and market capitalism cannot function without a robust audit function. If we do not save auditing, we cannot save capitalism.” 

And on fund managers.... " I was also rather underwhelmed during the Review by the interest in audit shown by some of the portfolio managers with whom I spoke. Few appeared to read the audit report thoroughly and several took the view that it was enough to know whether or not the auditor had given an unmodified opinion."

I do note, I did not speak to Brydon but have tangential advisory interests through being on an advisory group for IASB and for FRC.

Review can be found here.

The Private and External Costs of Germany's Nuclear Phase-Out

NBER Dec 2019. The Private and External Costs of Germany's Nuclear Phase-Out by Stephen JarvisOlivier DeschenesAkshaya Jha.

“Many countries have phased out nuclear electricity production in response to concerns about nuclear waste and the risk of nuclear accidents. This paper examines the impact of the shutdown of roughly half of the nuclear production capacity in Germany after the Fukushima accident in 2011. We use hourly data on power plant operations and a novel machine learning framework to estimate how plants would have operated differently if the phase-out had not occurred. We find that the lost nuclear electricity production due to the phase-out was replaced primarily by coal-fired production and net electricity imports. The social cost of this shift from nuclear to coal is approximately 12 billion dollars per year. Over 70% of this cost comes from the increased mortality risk associated with exposure to the local air pollution emitted when burning fossil fuels. Even the largest estimates of the reduction in the costs associated with nuclear accident risk and waste disposal due to the phase-out are far smaller than 12 billion dollars.”

Paper Here.